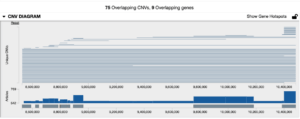
All unique CNVs overlapping with the searched CNV are displayed as individual blue tracks, with genomic position along the X axis. Hover over each blue track to see start and stop coordinates of the CNV, its size, and the number of articles that will be returned for that CNV.
Below the CNV tracks, Articles are displayed in a Manhattan plot in blue, where the Y axis is citations per CNV. Hover over blue blocks to see total article counts for that region, its size, and the start and stop positions.
Below Articles, the genes mapping to the genomic coordinates along the X axis are displayed in gray. Hover over the gray blocks to see the gene name, start and stop positions, and article count.